We are aware of terms like Cloud Computing, Artificial Intelligence, Internet of Things, Machine Learning and the ‘big’ thing, Big Data. Each one of technology innovation now taken considerable space in digital transformation. Different type of organizations are taking advantage of these technology methodologies. Due to this, we are experiencing enhancements in our daily lifestyle. There are so many use cases of each one of it. But the one case study I recently gone through is application of all these in one segment.
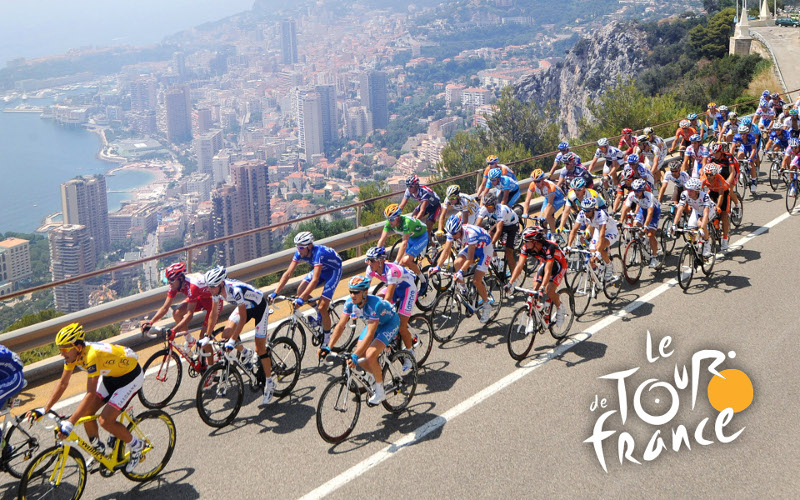
Everyone knows about World’s biggest sporting event – Tour De France. In its recent Tour De France competition in 2017, 22 team participated with around 200 riders. Distance for competition was 2200 miles. A competition always has tons of viewers in different kind of geographic area around the world. This cycle race gains huge attraction by audience due to its scale and beautiful terrains of France and other part of UK. But in 2015, hype around Tour De France suddenly spiked. Audience started getting real time statistics including current speed of riders, position, distance between riders and real time predictions such as winner of different stage of the competition. It was indeed a great addition of technology into a sporting event as people are now not just watching games on TV but they engage with game using social media. It is quite obvious to have a bit delay for data to post on social media and live publication on website. But surprisingly it takes only 2 seconds for data to travel from riders to centralized data center based in London. Then data stream is broadcasted to live tracking website and social platforms. On the first installment of this feature result was also astonishing. 663,912 visitors access the live tracking site, there were 1.3 millions engagements on social platforms.
We have to give credit to cloud and managed service company DimensionData for such incredible technical enhancement to cycling sport. It has definitely raised the quality of broadcasting and experience of worldwide users.
How did they do it?
DimensionData has collected and maintained records of live tracking since last two years. Adding to this, they have created database of performances, profiles, previous statistics of riders since last 5 years. This stored information helps DimensionData mechanism to understand in which environment and under what circumstances rider has performed well.
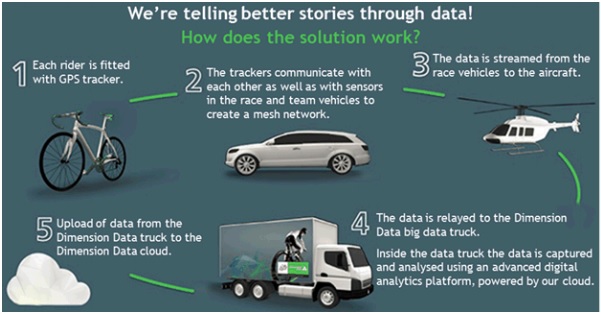
Source of the data is sensor, installed under the saddle of each of the bike. Sensor has weight around 100gm which contains GPS(Global Positioning System) chip, Low RF(Radio Frequency) Chip and rechargeable battery which can last till 21 stages. When a race starts, sensors produces information(position, speed) for particular cycle and starts sending to relay equipment placed in race vehicles which are used by staff and TV broadcasters. The sensor data further transmit to planes and helicopters who are monitoring race and then TV trucks at race finishing line. At TV truck, data is separated and further data captured by DimensionData’s command hub called ‘Big Data Truck’ which is placed at finish line at each stage. Big Data truck is on-the-wheel data center infrastructure having all necessary resources, collection of applications and tools from different vendors. Big Data truck is connected to DimensionData’s cloud services, located in data centers in London and Amsterdam. Here at data center, data collected from data feeds received from various race stages and previous historical data is combined. Data then processed through machine learning and predictive analytics algorithms to generate analysis like statistics and predictions. This analysis is then forwarded to viewers on live tracking website, social media platforms, mobile apps, TV channels and team staff. This whole process from bicycle to viewers takes 2 seconds of time.
Source: http://blog.dimensiondata.com/2015/07/how-our-great-people-are-powering-the-digital-tour-de-france/
Application of IoT, Cloud Computing, Big Data, Predictive Analytics, Machine Learning and DevOps
Big Data: Live tracking data collected from competitions in last 2 years and profiles, statistics, rider performance measurement data of 5 years is used to perform predictive analysis and machine learning stuff. Output is combined with feeds collected from data received from different race stages.
IoT: Whole process of real time transfer of data from race to viewers is start with sensors which produces data and send to replay equipments. A sensor perform a role of device having connected to network which sends data.
Cloud Computing: Whole operation could not have been possible without participation of cloud. As the data came from remotely from mountains road of Apls and Pyrenees, provision was needed to have centralized infrastructure for data analysis and transmission to broadcasting and publishing channels. Agile and efficient cloud computing environment made this operation real time for DimensionData.
Machine Learning & Predictive Analytics: DimensionData engineers written specific complex algorithms to generate predictive analytics and statistics from historical data as well as data obtained after combination of feed data. It was fantastic for a sport like Tour De France to have such kind of predictions in place, adding to real time statistics.
DevOps: This operation is further enriched by the DevOps capabilities of various cloud data centers and dedicated DevOps team of DimensionData. Teams sitting around the globe have access to all the information. DevOps approach allow engineers in Australia write code for visualize data and information in interesting ways, the code get tested at Hong Kong cloud data center before it is sent to data centers in London and Amsterdam for next day racing.
Conclusion
I think application of technology innovations like IoT, Cloud, Big Data, Machine Learning and DevOps in world’s famous sport event Tour De France sets a benchmark for digital revolution in sports arena. Not just sports, but such kind of application enabled decision makers and technical architects to acquire innovative possibilities in various sectors like healthcare, tourism, finance, business and many more.
References:
- http://www2.dimensiondata.com/en/tourdefrance/blog/how-data-analytics-creates-real-time-race-predictions
- http://bind40.com/2016/07/03/internet-of-things-and-le-tour/
- http://www.computerweekly.com/feature/Data-takes-to-the-road-the-technology-behind-the-Tour-de-France
- https://internetofbusiness.com/iot-digital-tour-de-france/
- http://www.networkworld.com/article/3197005/internet-of-things/adding-an-iot-dimension-to-le-tour.html
- http://www2.dimensiondata.com/tourdefrance/-/media/dd/tdf/pdfs/idc-opinion—ride-along-with-the-tour-de-france.pdf?la=en
- http://blog.dimensiondata.com/2015/07/how-our-great-people-are-powering-the-digital-tour-de-france/

Be First to Comment